Economic and Market Overview
February 2022
Global
The start of the year heralded an unpredicted slowdown in economic growth, lingering inflation, and many guesses regarding the pace of interest rate increases around the world.
According to the International Monetary Fund’s latest World Economic Outlook, the global economy entered 2022 in a weaker position than initially expected. As the new Omicron COVID-19 variant spreads, countries have reimposed mobility restrictions. Rising energy prices and supply disruptions have resulted in higher and more broad-based inflation than anticipated, notably in the United States and many emerging markets and developing economies. The ongoing retrenchment of China’s real estate sector and slower-than-expected recovery of private consumption also have limited growth prospects.
Global growth is expected to moderate from 5.9% in 2021 to 4.4% in 2022 – half a percentage point lower for 2022 than the October estimates. This largely reflects forecast markdowns in the two largest economies. A revised assumption removing the “Build Back Better” fiscal policy package from the baseline, earlier withdrawal of monetary accommodation, and continued supply shortages produced a downward 1.2 percentage-points revision for the United States. In China, pandemic-induced disruptions related to the zero-tolerance COVID-19 policy and protracted financial stress among property developers have induced a 0.8 percentage-point downgrade. Global growth is expected to slow to 3.8 percent in 2023. The forecast is conditional on adverse health outcomes declining to low levels in most countries by the end-2022, assuming vaccination rates improve worldwide and therapies become more effective.
Elevated inflation is expected to persist for longer than previously envisioned, with ongoing supply chain disruptions and high energy prices continuing in 2022. Assuming inflation expectations stay well-anchored, inflation should gradually decrease as supply-demand imbalances wane in 2022 and monetary policy in major economies responds.
With the exception of China, a tighter monetary policy is expected around the world. Estimates vary between three and seven interest rate increases in the United States. Against a historical context aggregate increases of between 1% and 2% over the next year would still keep the Fed Funds rate well below its long-term average and should therefore not be a major cause for concern. Speculation about the quantum and timing of these moves, coupled with geopolitical tensions and rapidly rising energy prices, could however lead to very nervous markets in the first half of 2022.
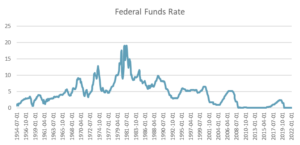
Sources: IMF World Economic Outlook January 2022, Board of Governors of the Federal Reserve System (US)
South Africa
The South African Reserve Bank’s Monetary Policy Committee (MPC) decided to increase the repurchase rate by 0.25%, taking it to 4%.
This move was broadly expected as it matched the guidance given by the Governor of the Reserve Bank in previous Monetary Policy Committee (MPC) statements. In their latest statement the MPC noted that South Africa’s economy rebounded strongly from the pandemic in 2021, but going forward the growth rate will, like global growth, slow and remain subject to various risks.
Laurium Capital reported that the meeting statement was seen as relatively dovish, particularly when compared to Fed communication at their January meeting that was interpreted as decidedly hawkish. Of the five MPC members, four voted for a 0.25% increase, and one member voted to keep rates unchanged, with the Governor confirming that no discussion of a 50bps hike took place (in contrast to some of the more hawkish market expectations leading into the meeting). The statement also confirmed that the Committee believes that a gradual rise in the repo rate will be sufficient to keep inflation expectations well anchored – implying a measured approach to the hiking cycle. December CPI printed at 5.9%, very close to the upper end of the SARB’s 3-6% target range, but is anticipated to moderate back towards the 4.5% mid-point by year-end (with elevated oil prices presenting an upside risk to forecasts).
They further said that, although policy settings in advanced economies remain accommodative, higher global inflation is likely to accelerate normalisation of interest rates and balance sheet reductions by major central banks. It is less certain how far the normalisation process will go and the exact timing and this uncertainty continues to cause financial market turmoil and capital flow volatility. Risk aversion in financial markets has increased. Economies that failed to take advantage of better global conditions or to reduce large macroeconomic imbalances remain vulnerable.
South Africa’s better than expected tax windfalls (mainly from higher tax receipts from mining companies), our access to low-interest loans from various global and regional financial entities, and a current account surplus were all factors that added to the recovery post the strict economic lockdowns in 2020. These favourable conditions will, however, not last into perpetuity and will not continue to balance political uncertainty, continued corruption, and Eskom’s struggle to keep the lights on.
Lastly: the rising price of oil has filtered into the fuel price as it increased to over R20 per liter at pumps in Gauteng. This will add upwards pressure to inflation. The graph below shows headline inflation compared to inflation excluding the effect of fuel prices. When the orange line is below the blue line fuel contributes to inflationary pressures – a situation we now find ourselves in:
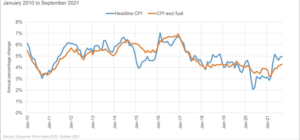
Source: StatsSA
Market Performance
The South African equity market started the year on a positive note as the FTSE/JSE All Share Index gained almost 1%, outperforming their global developed and emerging market counterparts by a wide margin, courtesy of strong performance from Sasol (+33%), BTI (+13%) and MTN (+12%). This was in stark contrast with global markets as the MSCI All Country World Index shed almost 5% (in US dollars) in January.
Local bonds added 0.8% for the month and still offer yields several percentage points above inflation. Property securities gave up some of the gains of the 4th quarter of 2021 as they retreated by around 3% during the month.
The rand strengthened against most of the major currencies. Interestingly enough, over the last 5 years, it has only depreciated by just over 3% per annum (versus the US dollar, Pound Sterling, and the euro) which is not far off the interest rate and inflation rate differentials between South Africa and developed markets. It either implies that investors were not necessarily rewarded for the political risk that is associated with many emerging market currencies, or that the political risk in South Africa is over-estimated by investors.
The oil price continued to rise during January (+17%) while gold pulled back by a little under 2%. Around the world, the sharply rising cost of energy (oil, gas, and paraffin among others) is likely to cause discontent among consumers with many developed market governments stepping in to soften the blow. In the United Kingdom, energy bills are predicted to rise by over 50% in April this year. Analysts at Bank of America Merrill Lynch estimate similar increases in Europe. Although not quite of the same quantum, South Africans are faced with a similar dilemma as Eskom is proposing electricity tariff increases of over 20% to the National Energy Regulator (NERSA) which is significantly beyond the current inflation rate. Geopolitical tensions in Eastern Europe and the Middle East will add to concerns about oil and gas supply and investors in these commodities are in for a rocky ride.
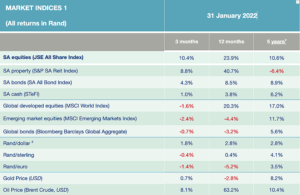
- Source: Factset
- All performance numbers in excess of 12 months are annualised
- A negative number means fewer rands are being paid per US dollar, so it implies a strengthening of the rand.
Commentary – South Africa: A Basket Case
You’d be forgiven for, after reading the title of this month’s commentary, giving a deep sigh and wondering what negative news about South Africa you’re about to read. To be honest it was really to get your attention. The basket we’re talking about is the one that is used by StatsSA to calculate the monthly change in South Africa’s consumer price index.
International standards prescribe that any country’s consumer basket, used by statisticians to calculate the monthly change in prices, should be reviewed every five years. StatsSA performed the previous revision in December 2016 so the next revision was due at the end of last year. The two main reasons why any inflation basket needs to be adjusted periodically is that price indices comprise of two main elements: the prices (which are updated monthly) and the composition of a typical consumer’s monthly spending on different goods and services (the weight of each price in the basket). In a country like South Africa with its wide divide between poor and rich, it is a challenge to construct a basket of goods and services representing the spending patterns of the “average consumer”. Someone living on the breadline may well argue that they never have (and never will) spent money on cappuccino sachets or pureed baby food, while a well-to-do citizen may not use bags of maize meal every month. That’s the thing about statistics – it reduces data to a useful quantity (in this instance the monthly change in consumer prices) but it implies that some detail is lost in the process.
So what does our inflation basket look like? It has over 400 items across 12 main categories. Food, beverages, and tobacco make up about one quarter, and clothing, housing, and its contents comprise another 30%. The cost of transport contributes 15% to the basket while education and communication are equally weighted around 2.4% each. The rest of the basket is made up of recreation and culture (about 5%), restaurants and hotels (3.5%), and miscellaneous goods and services (the remaining 15%).
The infographic below shows some of the items that have been added in the latest update, while DVD players, antennas, and satellite dishes have left the basket. If you are going to consider worthwhile New Year’s resolutions with respect to your approach to your savings and investment you may want to consider the following:
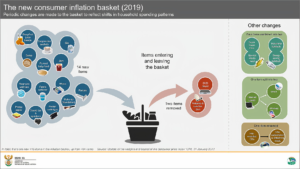
It’s noteworthy that, even though the change in composition is effective December 2021, the change refers to prices and weights as at the end of 2019. The reason for this is that the economic lockdowns during the COVID-19 pandemic caused irregular spending – for instance very little was channeled to hotels and restaurants while the amount spent on communication increased by multiples.
Commentary – South Africa: A Basket Case (Continued)
In case you have missed it: gin is in. As are cappuccino sachets, wipes, and printer cartridges. And make-up (or at least foundation) for all those Zoom calls where your video must be turned on…
In the light of the meteoric rise in the oil price (up 63% in US dollars over the last year), it’s easy to think that this should have had a more material impact on South Africa’s inflation rate. The reason why this is not so is that the fuel price makes up less than 5% of the total basket. A secondary reason is that the fuel price is not only determined by the price of oil – in fact, this factor makes up less than half of the fuel price as it stands, and often less than half when oil prices are lower. Taxes and levies account for one-third of the price, with sales margins and other costs making up about one-fifth:
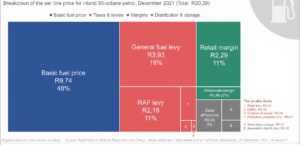
The conclusion is that changes in the rand price of oil only have a 2.5% direct contribution to the change in the inflation rate. There are indeed secondary effects as increased transport costs are reflected in other components of the inflation basket, but this takes time to present itself.
It’s clear that South Africa’s inflation basket does not represent every consumer’s spending, but rather the average consumer’s spending. To this extent, it remains a useful tool to determine how prices have changed on average. While StatsSA maintains the basket according to international standards (which they do), it will remain a core factor for any financial plan that aims to measure the change of a client’s purchasing power over time.
Source: StatsSA