Economic and Market Overview
Global
The last few months of 2021 seem to have ended in a similar fashion to the last two months of 2020 – on the back of a big wave.
This is not the type of wave that most holidaymakers in the Southern Hemisphere look forward to as the year draws to a close, but rather the spike in Covid-19 infections that can be attributed to the Omicron variant. This Covid mutation grabbed the late headlines in November, and in so doing gave markets a fright. With ongoing concerns over inflation and the pace of monetary policy tightening already weighing on investors’ minds, the sudden news of this apparently contagious new Covid variant and the immediate travel restrictions evoked parallels to the first lockdowns of March 2020 and brought selling pressure to bear on risk assets.
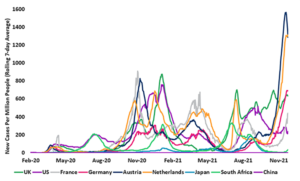
The chart below shows the rolling 7-day average of new cases (per million people to aid comparison across countries with varying populations) in a small sample of countries since the onset of the pandemic. As mentioned earlier, risk markets suffered a sell-off on Friday 26 November as news of an outbreak of the latest variant permeated global headlines. This comes at a time of rising cases, notably in Europe where restrictions had already started to increase, along with spikes in the case count in Austria, Netherlands, and Germany:
Source: Our World In Data
Investor sentiment has evidently turned more cautious of late. Whilst at the time of writing very little real evidence exists to support the efficacy of the vaccines against this new variant, markets have been rattled following comments from the Moderna CEO that they are likely to be less effective. The resulting flight to safety has ensued with US Treasury yields down, and ‘quality’ equities and technology stocks outperforming. Whilst other senior pharma figures indicate that extreme disease is still likely to be prevented by vaccines, the flurry of headlines certainly hasn’t helped market sentiment. On the brighter side vaccination rates in a lot of key global markets are high, now supplemented with ‘booster’ campaigns in many countries. There could be further market volatility as news is digested. However, as is often the case this can lead to overreaction which can throw up attractive opportunities for active longer-term investors.
South Africa
The South African Reserve Bank’s Monetary Policy Committee (MPC) decided to increase the repurchase rate by 0.25%, taking it to 3.75%.
This move did not come as a surprise to the market as it matched the guidance given by the Governor of the Reserve Bank in previous Monetary Policy Committee (MPC) statements. The implied policy rate path of the bank’s quarterly projection model (QPM) indicates an increase every quarter for the next three years. It’s important to remember that the repo rate projection from the QPM remains a broad policy guide, changing from meeting to meeting in response to new data and risks. However, if these increases were to transpire, it would merely bring interest rates back to where they were in July 2019. the graph below shows that such a pace of increases would be similar to the interest rate tightening cycle of 2013 to 2015:

Source: South African Reserve Bank
Given the expected trajectory for headline inflation and upside risks, the MPC believes a gradual rise in the repo rate will be sufficient to keep inflation expectations well anchored and moderate the future path of interest rates. Many analysts believe that the rate of the interest rate increase will turn out to be slower than anticipated by the Reserve Bank, but it’s clear that the general trend will be upwards.
The Minister of Finance delivered the Medium-Term Budget Policy Statement (MTBPS) earlier in the month posting an improved outlook to the February budget. According to Visio Capital, it however leaves more questions than answers as to the prospects of fiscal consolidation. The better outcome versus the February budget is predominantly the result of very strong commodity prices which cannot be considered permanent. Ultimately, debt stabilisation will only happen if the government successfully implements structural reforms necessary to bolster economic growth. It may sound like a simple solution to a complex problem, but the difficulty lies in the governing party mustering the political will to make these changes which are unlikely to increase their popularity among their traditional supporters.
Market Performance
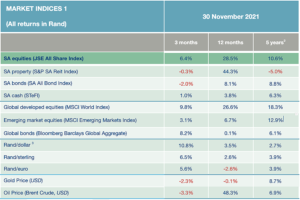
November saw a strong start to equity markets around the globe but as details about the Omicron variant of Covid-19 emerged these gains were more than given back and markets ended the month generally lower. Global equities ended 2.4% in the red (in US dollar terms) and emerging markets gave up 4.1%. In the United States, the S&P 500 fell 0.7% after losing nearly 2% on the last day of the month, as the new variant, continued high inflation, and Fed tapering weighed on sentiment. Despite the recent decline, the S&P 500 remained up 23.2% since the start of the year.
The domestic equity market, after gaining 5.4% by the middle of the month, lost most of its gains on the Omicron news, only to recover and end the month up 4.5%. The strong performance was led by resource and other rand hedge stocks (Richemont and MTN in particular) which were supported by the weaker rand which lost 4.6% against the greenback in November.
Most commodities also traded lower during the month with oil, in particular, retracing from its recent lofty levels. It’s still up more than one-third from the start of the year which is one of the reasons why inflation is rearing its ugly head.
-
Source: Factset
-
All performance figures for more than 12 months are annualized.
-
A negative figure implies that fewer rands are paid per US dollar, so this indicates a strengthening of the rand.
Commentary – How Did We Get Here?
Today, the global population is estimated to sit at 7.91 billion people.
By the end of 2022 or within the first months of 2023, that number is expected to officially cross the 8 billion mark. Incredibly, each new billion people has come faster than the previous – it was roughly only a decade ago that we crossed the 7 billion threshold.
How did we get here, and what has global population growth looked like historically?
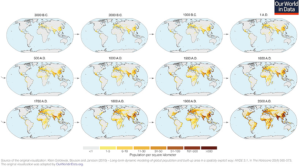
The maps below show how the earth’s population has grown over the last 5000 years. New York, São Paulo, and Jakarta were not always bustling metropolises. In fact, for long parts of the history of civilization, it was unusual to find humans congregating in many of the present-day city locations we now think of as population centers. The human population has always moved around, seeking out new opportunities and freedoms. Just like they do now that some jobs can be done remotely on a permanent basis:
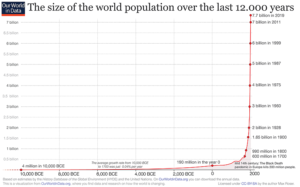
The following graph shows that human population growth started going exponential around the time of the second agricultural revolution which started in the 17th century in Britain. This is when new technologies and farming conventions took root, making it possible to grow the food supply at an unprecedented pace:
Commentary – How Did We Get Here? (continued)
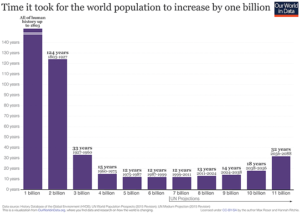
It took all of human history until 1803 to reach the first billion in population. The next billion took 124 years and the next 33 years. More recent billions have come every dozen or so, but from projections, the addition of a billion people in the future will steadily increase. So why then, are future billion people additions projected to take longer and longer to achieve, and will the global population reach a plateau (or even shrink)?
Population projections by groups like the United Nations see the global population peaking at around 10.9 billion people in 2100:
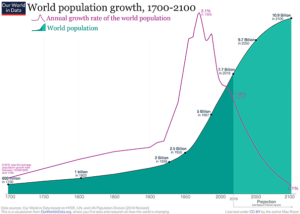
All of these developments will have a significant impact on the earth’s scarce resources, both for owners and consumers thereof. Investors with very long time horizons will no doubt take note of the change in the world’s population and its effect on asset classes and businesses. It’s a slow but inevitable change that will reward those who pay attention to its influence.
